M&A practitioners attribute deal failure to many factors: from poor cultural fit to unclear strategy and a lack of senior management commitment. What unites all these risks is that they can be mitigated with a well-planned and managed M&A pipeline.
Moreover, the M&A deal pipeline helps dealmakers gain competitive advantages and achieve better synergies, such as cost and revenue synergies.
This article dwells on the M&A pipeline’s meaning, its key stages, and potential challenges. Additionally, we provide recommendations on how to build an M&A pipeline and share the best practices. Keep reading.
What is an M&A pipeline?
M&A pipeline (sometimes referred to as M&A funnel) refers to the sequence of events happening during the M&A process.
In other words, the M&A pipeline comprises all the main stages of an M&A lifecycle: from strategy development to post-merger integration.
For a serious strategic acquirer, building a strong M&A pipeline makes absolute sense and is something that senior management needs to constantly spend time on. At the end of the day, deals are not only about numbers and spreadsheets, but about people and relationships as well.
Christopher Kummer
Founder and CEO of IMAA
By implementing a well-planned and managed M&A pipeline, dealmakers ensure that the complex M&A process is streamlined, all participants know their areas of responsibility, and all the stages have clear timelines, objectives, and key success metrics.
Six key stages of the M&A pipeline
Let’s now take a closer look at the main M&A pipeline stages. Typically, there are six of them.
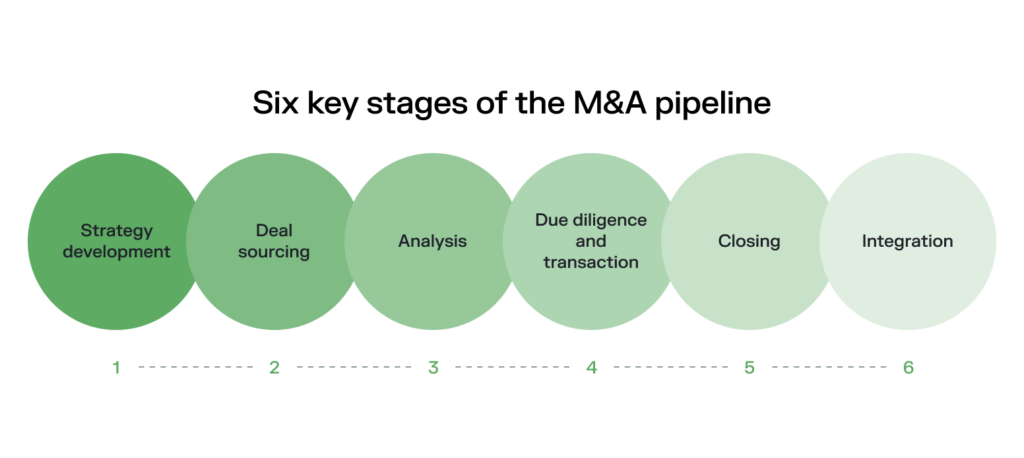
1. Strategy development
M&A pipeline steps begin with the acquisition planning and development of an acquisitions strategy that involves defining the objectives and criteria for potential acquisitions.
This stage includes aligning the M&A strategy with the overall corporate strategy, identifying target sectors, and establishing the financial and strategic goals. It helps to define the companies fit to be targeted and the expected outcomes from the potential acquisition.
Additional reading: Learn the main specifics of defining the right M&A strategy for your transaction in our dedicated article with M&A strategies examples.
2. Deal sourcing
Based on the clearly defined M&A strategy, the buy-side of the M&A process then searches for the most appropriate and fruitful targets.
This involves networking, market research, and leveraging financial advisors or brokers to find suitable companies that meet the pre-defined criteria. The goal is to create a list of viable candidates for further evaluation and for the potential deal moving forward.
3. Analysis
This stage includes initial data requests from the potential target and their further analysis.
Initial data request implies analyzing the target’s business model, financial modeling, market position, and strategic fit. The objective is to identify the best prospects that align with strategic goals and financial expectations.
4. Due diligence and transaction
Based on the previous stage findings, the buyer decides on the best candidate and proceeds with due diligence, one of the most important factors in achieving the deal’s success.
Unlike preliminary analysis of the target that provides just a brief overview of its operations, due diligence allows seeing both the big picture and tiny details of data that are not publicly available.
The due diligence process involves thoroughly investigating a target company’s business, including legal, financial, and operational aspects, to confirm all material facts and assess risks.
Once due diligence is satisfactory, deal teams negotiate transaction terms and draft and sign definitive agreements.
Note: At this stage, the deal team often uses dedicated M&A deal management or project management software that enables a collaborative and efficient process and offers various project management features to track deal progress.
5. Closing
Closing is the final step where the transaction is officially completed. It involves finalizing all legal documents, transferring ownership, and ensuring all conditions are met. Funds are transferred, and the target company’s control is handed over to the acquirer.
6. Integration
Integration is the process of combining the operations, cultures, and systems of the acquired company with the acquiring company.
This stage focuses on realizing the synergies identified during the earlier stages and ensuring a smooth transition. Effective integration is crucial for achieving the strategic and financial objectives of the acquisition.
How to build a robust M&A pipeline in 10 steps
Considering the main stages of the M&A pipeline, below are the common steps a dealmaker should take for a strong and effective pipeline development and deal flow improvement.
The first step is to clearly understand the acquisition’s motive and include it in the M&A strategy. It could be market expansion, diversification, acquiring new technologies, or increasing market share.
This includes determining key metrics for the potential strategic fit identification. Such metrics can include financial, operational, and cultural specifics: from revenue, EBITDA, and profit margins to geographical presence, customer base, and cultural values.
To proceed with deal sourcing, you first need to make up a team of responsible specialists. The deal team usually comprises internal employees and outside financial advisors and brokers. Together, they perform market research and attend industry conferences, trade shows, and networking events to identify potential targets and build relationships.
Use databases, market research reports, and competitive analysis to compile a list of potential targets. Rank targets based on strategic fit, financial health, and acquisition feasibility.
Once you have the list of potential targets, approach prioritized ones to assess their interest and obtain preliminary information. Based on the received data, perform initial financial analysis, market assessment, and strategic fit evaluation.
Having decided on the best fit, conduct thorough due diligence covering financial, legal, operational, and technological aspects. Additionally, evaluate the target go-to-market position and determine its true value using various valuation methods (DCF, comparables, precedent transactions). Finally, identify potential risks and mitigation strategies.
If the due diligence results are satisfactory, plan for post-acquisition integration, covering operational, cultural, and structural aspects. Identify and quantify synergies, and develop a detailed plan to achieve them.
Determine how the acquisition will be financed (cash, stock, debt, or a combination) and engage with financial institutions or investors to secure necessary funding.
Negotiate terms and conditions, focusing on price, representations and warranties, indemnities, and other key terms. After this, draft and finalize the purchase agreement and other legal documents.
To successfully finalize the deal, execute the pre-made integration plan, ensuring clear communication and alignment across teams. It’s also essential to continuously monitor performance against pre-defined metrics to ensure the acquisition achieves the desired outcomes.
Best practices for managing the M&A pipeline effectively
M&A pipeline management is about the M&A process optimization and ensuring a smooth transition between each stage. Below are several core recommendations to manage M&A deal flow effectively:
- Start integration planning early
One of the critical integration practices includes developing integration plans early, ideally during the due diligence stage. Such a structured approach allows for timely addressing of potential challenges and ensuring a smooth transition post-acquisition. - Ensure strategic communication transparency at all levels
Maintain open and clear communication with all stakeholders – including employees, customers, integration team members, and investors – to manage expectations and foster trust. - Use pipeline management software
Choose an M&A pipeline management software to track and manage the transaction efficiently, ensuring visibility and organization throughout the process. What’s more, modern lifecycle management software allows for navigating multiple deals at once. This makes them perfect for cooperation with several potential targets during the due diligence phase, for example. - Track company personnel risks
Any disruptions in the M&A pipeline are often caused due to certain personnel issues. Identify and assess key personnel risks to mitigate potential disruptions and ensure continuity in leadership and operations post-acquisition.
M&A pipeline challenges
Now, let’s briefly review the main challenges that occur during M&A pipeline management and suggest possible solutions to them.
Deal stagnation
The deal execution can often take too long and even stall at some point. The reasons are generally prolonged decision-making, lack of consensus among stakeholders, or market uncertainties.
Possible solution
- Establish clear timelines and milestones
- Assign a dedicated deal corporate development team to keep the momentum
- Maintain open and frequent communication with all stakeholders
- Streamline decision-making processes and obtain necessary approvals in advance
Inadequate due diligence
Insufficient due diligence can lead to overlooking critical risks, resulting in overvaluation or missed liabilities. Moreover, poor due diligence is among the main reasons for deal failure, according to Bain.
Possible solution
- Implement comprehensive due diligence checklists covering all critical areas
- Involve cross-functional teams (legal, financial, operational, and cultural) in the due diligence process
- Use third-party experts for specialized areas
- Conduct multiple levels of review to ensure thoroughness
Misalignment of strategic objectives
Sometimes differences in strategic goals and priorities can occur between the acquiring and target companies. This can create tension and hinder the deal’s success.
Possible solution
- Clearly define and communicate the strategic objectives of the M&A
- Ensure alignment through pre-merger discussions and negotiations
- Develop a shared vision and integration plan that aligns with both companies’ goals
- Engage senior leadership from both sides to foster alignment and commitment
Synergies overvaluation or underestimation
Overvaluation or underestimation are also common reasons for a deal’s failure. Overestimating synergies can lead to unrealistic expectations while underestimating them can result in missed opportunities.
Possible solution
- Conduct a detailed and realistic analysis of potential synergies
- Use historical data and benchmarks from similar deals for correct estimation
- Develop a robust integration plan to realize identified synergies
- Monitor and adjust synergy targets post-merger based on actual performance
Key talent loss
A company can often lose key employees during or after the M&A process due to uncertainty or dissatisfaction, impacting the combined entity’s performance. In fact, the inability to retain key talent is a reason for deal failure in 20% of cases.
Possible solution
- Identify and prioritize key talent early in the process
- Develop retention plans, including incentives and clear communication of employee’s role in the combined company
- Foster a positive and inclusive culture that values employees from both organizations
- Provide clear career development opportunities and support during the transition
Key takeaways
Let’s summarize the main points from the article:
- The M&A pipeline is a flow of events that occur during mergers and acquisitions.
- Dealmakers define six main stages of the M&A pipeline: strategy development, deal sourcing, analysis, due diligence and transaction, closing, and integration.
- Among the challenges that can take place in the M&A pipeline management process are deal stagnation, poor due diligence, misalignment of strategic objectives, overestimation or undervaluation, and loss of key talent.
Though dealmakers admit certain lethargy of the global M&A activity in most sectors recently, 2023 brought some hope, with mergers and acquisitions in the middle market showing some positive movements. Thus, 55% of dealmakers expect more middle-market deal activity in 2024, according to ACG’s survey.
In this article we explore the current M&A middle market, outline its potential challenges, and try to predict its performance in 2024.
The rise of middle market M&A
Before delving into trends in mid-market mergers and acquisitions, let’s first recap what kind of M&A deals sit in the middle market.

So what are the key trends of the current M&A market, and how do middle market transactions take the lead? This is what PwC’s M&A 2023 report states about this:
- Compared to record-breaking M&A activity in 2021 and those of pre-pandemic levels, global deal values dropped 50% to $2.5 trillion in 2023. Deal volumes also declined by 17% from about 65,000 deals in 2021 to nearly 55,000 deals in 2023.
- The number of megadeals fell by almost 60% — from 150 transactions in 2021 to less than 60 deals in 2023.
- At the same time, mid-market transactions stood up and showed certain improvements. This is because such finance deals are easier to conduct during a global financial crisis and geopolitical tensions, and dealmakers now follow a strategy of making a series of small deals when seeking transformation and growth.
Malcolm Lloyd, Global Deals Leader and Partner from PwC Spain, believes that global deal-making shows signs of rebounding and has promising potential in 2024:
Market signals are more positive, and we’re seeing a willingness among dealmakers to find creative solutions to get deals done and accelerate transformation. I believe these factors — and pent-up demand — have created a tipping point, and we will see an upswing in M&A in 2024.
2024 opportunities in mid-market M&A
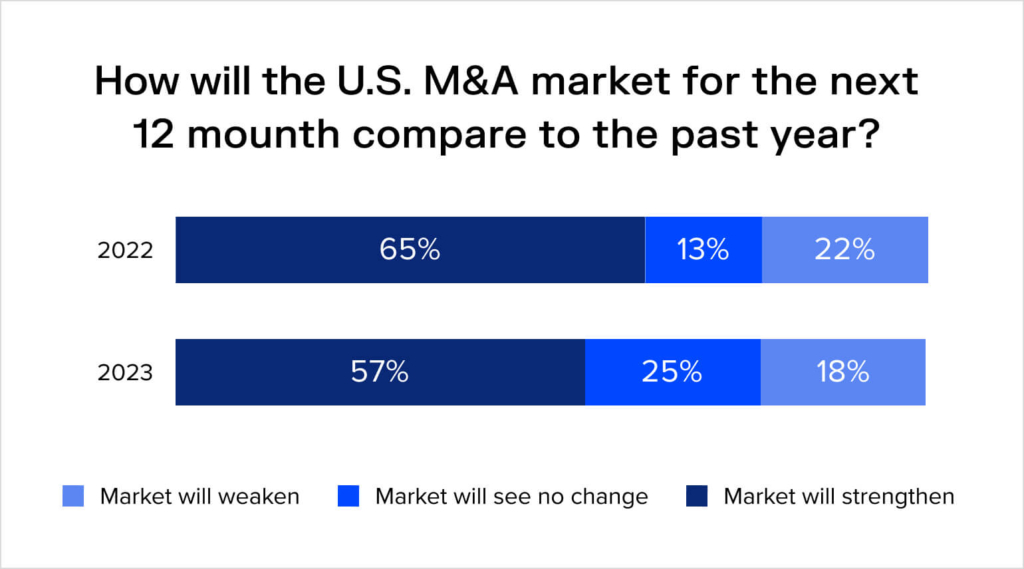
According to Dykema’s M&A Outlook Survey, 57% of respondents expect the M&A market to strengthen in 2024.
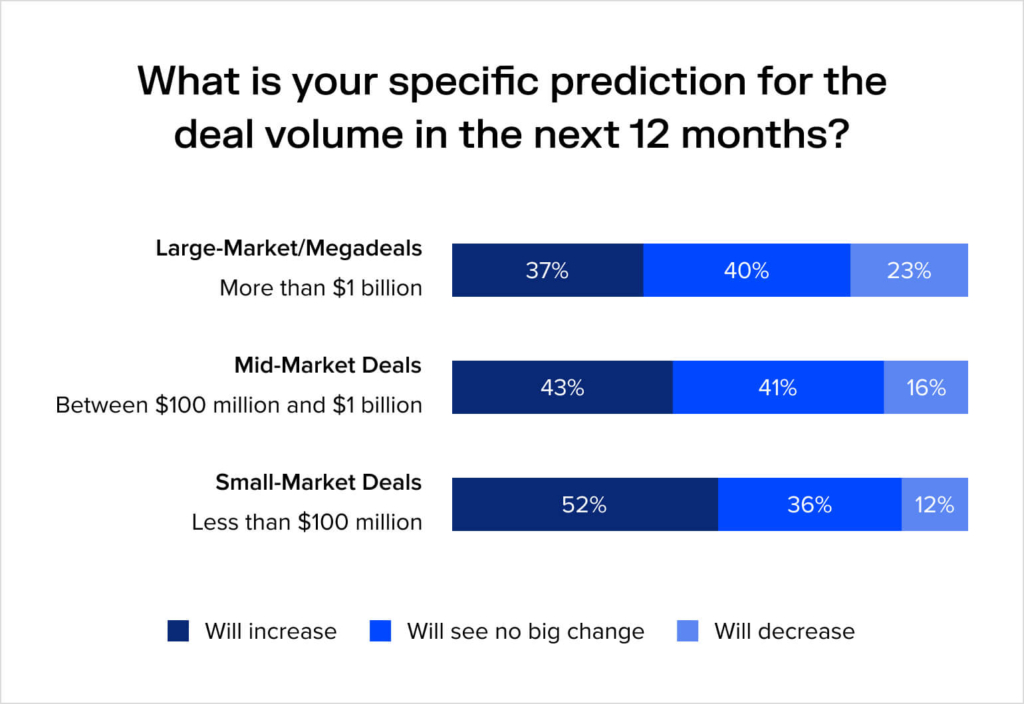
At the same time, most respondents predict a deal volume increase in middle and lower markets in particular: 43% of surveyed dealmakers expect a rise in middle market deals and 52% believe a boost will take place in lower markets.
So, let’s now discuss the main signs of the middle market’s potential to keep rising in 2024 and the key trends in this process.
Hopes for potential M&A activity improvement
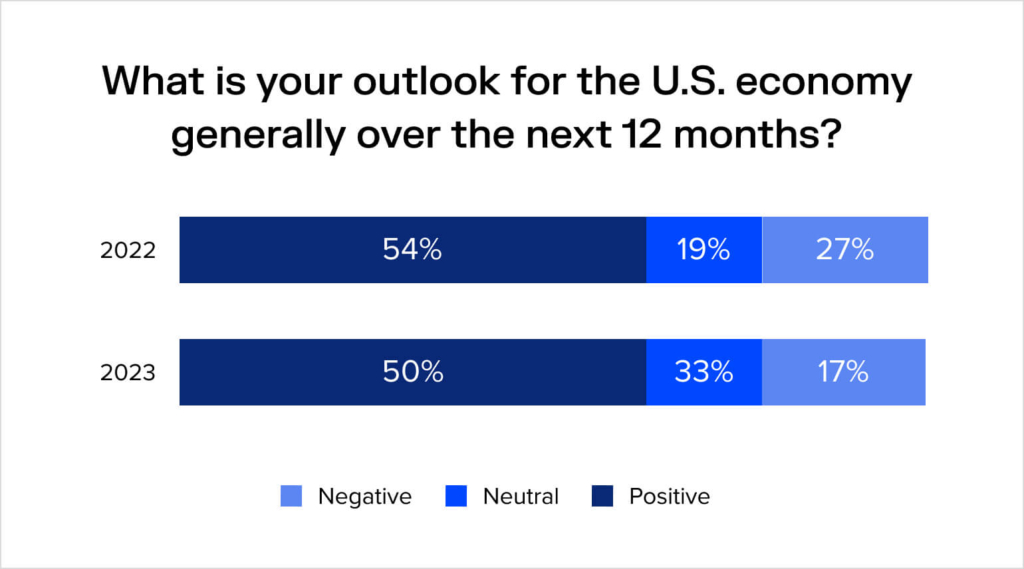
M&A practitioners have largely positive expectations for the economy in 2024. The above-mentioned Dykema survey indicates that 50% of surveyed dealmakers have a positive outlook for the US economy over the next 12 months, while only 17% have negative expectations.
Positive anticipation is also seen from the PwC’s 27th Annual Global CEO Survey, where 60% of CEOs state they plan to make at least one acquisition in the next three years.
3 sectors are likely to take the lead
When it comes to business sectors, M&A practitioners and business leaders expect the most middle-market investments to be seen in the energy, financial services, and healthcare areas.
At the same time, PwC specialists predict that M&A recovery in financial and healthcare services might not be as rapid as in the energy sector.
Interest from private equity firms continues
During recent years, the quantity of dry powder was increasing while investors remained selective. In 2023, dry powder reserves in the private equity industry hit $4 trillion.
Such a large amount of dry powder speaks volumes about the high possibility of private equity firm investors stepping into the market and putting this money to work. Considering global trends and overall cautiousness, the investment choice might fall on the lower middle market and middle market companies, as they’re more agile and can adapt to tense economic circumstances, and thus, present less risk to investors.
Note: Read more about different types of business acquisition financing in our dedicated article.
Challenges in navigating middle market M&A
While mid-market M&A transactions are likely to rebound in the next 12 months, such deals also face certain challenges that may significantly impact deal value, cost savings, and overall outcomes.
Let’s briefly review the three main challenges for middle-market M&A deals.
Lack of experience
90% of middle-market companies that were sold or merged and 70% of middle-market companies that made an acquisition in the last three years had little or no previous M&A experience. This leaves them more reliant on advisors and makes it more difficult to avoid mistakes and ensure a smooth transition.
Quick tips:
- Create a thorough middle market acquisition strategy, paying special attention to outlining deal targets and expected outcomes.
- Engage experts, such as M&A advisors, investment bankers, or consultants who can provide valuable insights, guidance, and support throughout the entire M&A process.
Incorrect assessment
41% of buyers and 43% of sellers from the middle market companies admit they find it very difficult to perform a correct valuation of the business they’re buying or selling. This can also relate to the lack of experience in M&A activities.
Quick tips:
- Conduct comprehensive due diligence covering all aspects of the business, including financial, operational, legal, and cultural factors.
- Engage experienced professionals and specialized teams to perform due diligence, ensuring that all potential risks and opportunities are identified and properly evaluated before proceeding with the transaction.
Integration challenges
Another significant challenge mid-market M&A practitioners may face is complications during the integration process.
According to research, 44% of buyers and 44% of sellers believe that post-merger integration (both technical and cultural) is a major challenge during the M&A process.
Quick tips:
- Develop a detailed integration plan that outlines specific goals, timelines, responsibilities, and milestones for each aspect of the integration process.
- Involve key stakeholders from both companies early in the integration planning process to ensure alignment and buy-in.
- Ensure transparent and regular communication to address concerns, manage expectations, and foster a collaborative and cohesive organizational culture.
Note: Explore the major types of general mergers and acquisitions risk in our dedicated article.
Best practices for successful middle-market deals
To ensure successful middle-market M&A activity in 2024, dealmakers should consider the following recommendations:
- Prioritize strategy
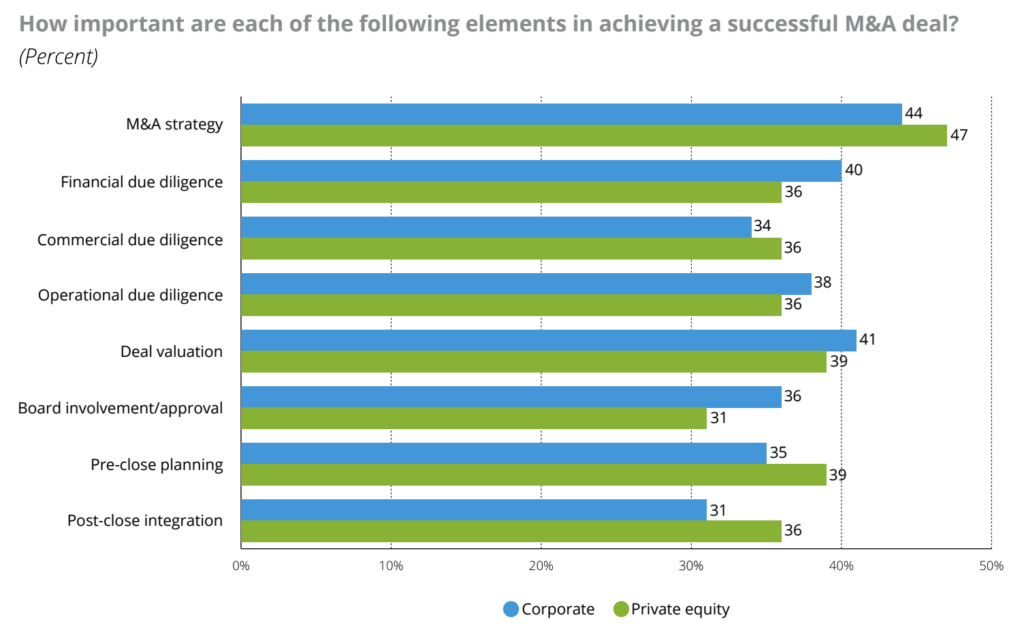
Having a thorough M&A strategy is as important as having a business model for a business to work. According to the Deloitte 2024 M&A Trends Survey, 44% of corporate executives name M&A strategy as the key aspect in achieving deal success. Read more about mergers and acquisitions strategy in our dedicated article.
- Mind the digitalization impact
There’s a high chance that in 2024 dealmakers will target companies that successfully implement AI capabilities in their operations. As a result, middle-market businesses need to prioritize digitalization and find ways to integrate AI into their services to stay attractive to potential investors.
- Engage third-party experts
Considering the fact that middle-market dealmakers typically lack expertise in M&A activities, having experienced professionals involved in the deal process might increase its chances of success.
Key takeaways
- Despite the overall lethargy of global M&A activity, M&A practitioners see signs of a rebound in the middle-market M&A sector.
- Large volumes of dry powder reserves predicted reductions in interest rates, and an overall need for businesses to adapt to global financial crises and geopolitical tensions could provide growth opportunities for M&A activity in 2024.
- M&A experts predict positive improvements in the middle market since such deals are easier to conduct and dealmakers now follow a strategy of making a series of small deals when seeking transformation and growth.
A special purpose acquisition company (SPAC) is a shell company formed solely to raise capital through an initial public offering (IPO). The purpose is to acquire or merge with an existing private company, taking it public. Some market participants view SPAC transactions as providing private companies with greater certainty in pricing and control over deal terms, compared to a traditional IPO.
In April 2021, the Securities and Exchange Commission (SEC) issued staff statements on how SPACs were handling their warrants. It pointed out that many SPACs were incorrectly categorizing their warrants as stock. But, according to the SEC, these warrants should be considered liabilities in certain circumstances. Such increased regulatory scrutiny led to a decrease in SPAC issuances.
The article aims to demystify SPAC warrants by answering common questions, such as: What is a SPAC warrant? How do warrants work in a SPAC? How to exercise warrants? And how to trade SPAC warrants?
SPAC warrants explained
Investors in SPACs typically buy what are known as SPAC units. A SPAC unit consists of shares and warrants, or even fractional warrants, such as a quarter of a whole warrant (per unit).
Therefore, SPAC warrants can be defined as financial instruments issued by SPACs during IPOs. These are contracts that give investors the right to purchase a predetermined number of common shares of the SPAC at a certain price (the strike price) in the future, often a premium to the stock price at the time the warrant is issued.
Typically, SPAC warrants have a specified exercise period (often several years), during which investors can choose to exercise their warrants. If exercised, investors pay the strike price to the SPAC and receive the corresponding common shares.
Warrants can be traded separately from the SPAC’s common stock, allowing investors to speculate on the future performance of the SPAC or hedge their investment risk.
There are public and private placement warrants, each with its peculiarities.
Public warrants:
- Issued alongside SPAC shares during the IPO.
- Typically have a strike price of $11.50 or higher (such price is chosen to encourage investors to buy the warrants by offering potential profit above the $10 initial offering price).
- Subject to a lock-up period, often one year after issuance or after a merger or acquisition.
Private warrants:
- Offered to SPAC sponsors or founders before the IPO (known as the “promote”).
- Can have a purchase price significantly below the original SPAC share price.
- May have cash and cashless exercise options or have no SPAC warrant redemption terms.
- Redemption prices may fluctuate based on warrant terms and market conditions.
Additional reading: Explore reverse triangular mergers to learn how to utilize financial and legal mechanisms for efficient corporate acquisitions.
How do SPAC warrants work?
Overall, the SPAC lifecycle involves the formation of the SPAC, the IPO and capital raising process, the search for and acquisition of a target company, and the completion of the merger or acquisition.
Warrants are typically issued during the IPO stage of the SPAC lifecycle. Investors who participate in the IPO by purchasing SPAC units receive a combination of common stock and warrants. These warrants entitle holders to purchase additional shares of the SPAC at a predetermined price in the future.
Warrants can be a large contributor to total returns, as they often carry value beyond the share price alone. In a standard SPAC, where investors typically receive half a warrant with each purchased unit, the value of warrants is influenced by factors like current share price, volatility, and time to maturity. As share prices increase, so does the value of warrants, adding substantial percentage points to total returns.
To understand how SPAC warrants work, let’s use the example of the Cyxtera merger, with insights from Matt Frankel, a financial professional, who, in response to Cyxtera investor question, explains how and when to exercise the warrants:
- Warrant terms. Warrants typically grant investors the right to purchase shares of the company at a fixed price within a specified timeframe, often five years. In the case of Cyxtera, one warrant allows the holder to buy one share at $11.50 within the next five years.
- Forced exercise circumstances. There are circumstances where warrants can be forced to be exercised early. If the stock trades at $18 or more for 30 consecutive days, the company can redeem the warrants essentially for nothing.
- Staying informed. Investors need to closely monitor news alerts for any announcements regarding warrant redemption. This allows investors to stay informed and make timely decisions regarding whether to exercise, sell, or hold onto their warrants.
- Risk assessment in SPACs. If investors are uncomfortable with tracking news or potential warrant redemptions, they may choose to sell their warrants or focus solely on owning the stock. This ensures investors can mitigate the risk of being caught off guard by warrant redemptions.
Note: When a SPAC completes its initial business combination, the ticker symbols for the combined entity’s stocks and warrants change. Investors wishing to exercise their warrants should keep this in mind.
How to get started
Here’s what to do to start investing in SPAC warrants:
- Choose the right broker. Select a reputable broker like Webull, Robinhood, Fidelity, or Interactive Brokers that offers warrants on their platform. Consider factors such as trading features, fees, and customer support to ensure a smooth trading experience.
- Research and select SPAC warrants. Conduct thorough research on SPAC warrants available on a chosen broker’s platform. Look for warrants from trusted SPACs run by experienced professionals, and be cautious of cheap options.
- Calculate the theoretical valuation of a warrant. Use online price calculators that allow you to input various factors and valuation metrics, such as implied volatility and the pricing model. This can help identify the fair value of a warrant. You might also be interested in reading our business valuation tutorial.
Characteristics of SPAC warrants
SPAC warrants have certain features that differentiate them from other financial instruments. Here are some key characteristics:
- Warrant exercise price
Warrants have a predetermined exercise price, which is the price at which the warrant holder can purchase the underlying common shares. This exercise price is set at the time of issuance and is typically at a premium to the SPAC’s IPO price. The exercise price is fixed and doesn’t change over the life of the warrant.
- Limited investor rights
Warrant holders typically don’t have voting or dividend rights. This distinguishes them from common shareholders who have these privileges.
- Correlation with the underlying stock
SPAC warrants’ prices generally move in tandem with the underlying stock prices. This makes warrants highly sensitive to market volatility.
- Dependency on merger success
The value of SPAC warrants after the merger heavily relies on the merger’s success. In cases where a SPAC merger fails, warrant values may drop, sometimes to near-zero levels.
- Dilution impact
When warrants are exercised, SPACs must issue new shares, resulting in dilution for existing shareholders. This dilution can impact earnings per share and share price.
- Warrant expiry date
Just like in options trading, warrants have an expiration date, which is the deadline by which the warrant must be exercised. If the warrant isn’t exercised before the expiry date, it becomes worthless, and the holder loses the right to purchase the underlying shares. The expiry date is set at the time of issuance and is often up to five years after the acquisition or merger.
- Early redemption features
Even though SPAC warrants theoretically have an expiration date of up to five years, the majority include early warrant redemption deal terms. For example, some may have conditions under which warrants must be redeemed within 30 days if the stock price remains above a certain level for a certain period.
Additional reading: Discover how to expand a business globally by reading our comprehensive article on the topic.
Value and risks of investing in SPAC warrants
Let’s take a look at the key advantages and disadvantages of investing in warrants.
Value
- Potential for high returns
SPAC warrants offer unlimited profit potential if the performance of the underlying stock is strong.
- Liquidity considerations
The warrant market is generally very liquid, allowing investors to easily buy and sell warrants on the stock exchange, providing flexibility in their investment strategies.
- Diversification
Warrants can facilitate diversification as they often have a lower entry cost compared to buying the underlying asset outright, allowing investors to spread their investment across multiple assets.
- Leverage
SPAC warrants can strengthen returns as they provide investors with the ability to control a larger position in the underlying stock with a smaller investment, potentially maximizing profits in a given period.
- Smaller initial investment
Warrants typically require a smaller initial investment compared to buying common shares.
Risks
- Complexity
Warrants are complex financial instruments and due to their complexity they may not be suitable for inexperienced investors.
- Lack of standardization
Warrants often lack standardization across offerings, requiring investors to carefully analyze the terms and conditions of each warrant, which can increase the complexity of investing.
- Bigger risks
While warrants offer leverage and potential for higher returns, they also come with bigger risks.
- Discounted pricing
Warrants may trade at a discount relative to their equivalent common stock due to the risk of merger failure or other uncertainties, which could lead to losses if the warrant becomes worthless.
- Regulatory risks
Regulatory changes, including those issued by agencies like the Securities and Exchange Commission, affect SPAC warrants and can change their value and how they trade.
Strategic considerations for investors
Strategic considerations for exercising warrants involve assessing various factors, including:
- Due diligence. When investing in a SPAC through an IPO, investors should conduct due diligence and ensure the SPAC is managed by experienced professionals. The success of the investment largely depends on whether a merger occurs, so trust in the SPAC’s management team is very important.
- Expiry date. Exercising warrants before the expiry date ensures that investors don’t lose the opportunity to convert SPAC warrants into underlying shares. However, exercising too early may not be optimal if the stock price has not yet reached a favorable level. Therefore, investors should wait for the optimal time.
- Specific terms. Understanding the terms and conditions of warrants is essential for building effective trading strategies. Investors should thoroughly review these terms before exercising warrants. For example, warrants may include clauses specifying conditions under which they must be redeemed early.
- Tax implications. Depending on the jurisdiction and individual circumstances, exercising warrants may trigger capital gains taxes or other tax liabilities. Investors should consult with tax advisors to understand the tax implications of exercising warrants and plan accordingly.
- Portfolio diversification. Investors should consider how exercising warrants fits into their overall investment strategy and portfolio diversification goals. For example, exercising warrants to acquire additional shares of a particular company may concentrate portfolio risk if the investor is already heavily invested in that company or sector.
Long-term vs short-term investment
Determining whether to treat SPAC warrants as a long-term growth potential investment or a short-term speculative opportunity requires careful consideration of various factors.

Key takeaways
- Special purpose acquisition companies (SPACs) are companies with no commercial operations. They are created only to raise capital through initial public offerings to acquire or merge with an existing company.
- SPAC warrants are financial instruments issued during IPOs that give investors the right to purchase common shares at a predetermined price, typically at a premium to the IPO price, offering the potential for high returns.
- Investors should carefully review the terms and conditions of SPAC warrants, considering factors such as early redemption features, expiration dates, and dilution impact, to mitigate risks and optimize their investment outcomes.
- Strategic considerations for investors include conducting thorough due diligence on SPAC management teams, evaluating market trends, understanding warrant terms, assessing tax implications, and aligning warrant exercise decisions with overall portfolio diversification goals.
- The regulatory environment surrounding SPAC warrants is constantly changing, so staying informed about updates and developments is crucial for investors to navigate potential risks effectively.

Value creation and value capture, even if closely related, are two distinct aspects that play both a fundamental role in, for example, designing a new business model or undertaking a process of business model innovation.
When we talk about value creation, we are referring to the extra benefit that is derived from the transformation of raw inputs to final products.
Creating value is an essential part of supporting a profitable and lasting business. It helps sell products and services to customers, thus maximizing profit; internally, it contributes to employees’ higher efficiency and, ultimately, in increasing stock prices for shareholders.
On the other hand, capturing value refers to your capacity as a company to retain the value generated (value creation) for yourself, as your retained profit.
Benjamin Forestier, a lecturer in Corporate Finance, Private Equity, Financial Policy, and M&A at several prestigious business schools in France, has shared with us his take on the difference between value creation and value capture.
Creating value does not equal to capturing value
We all know the famous equity bridge in which you can decompose a buyout multiple on invested capital (MOIC)/internal rate of return (IRR) into sales organic growth/M&A/EBITDA margin improvement/deleveraging and multiple expansion components. Usually, we claim that everything which is not deleveraging nor multiple expansion equals “value creation”.
Allow me to be more nuanced and introduce the concept of “value capture”. In a buyout, there are numerous stakeholders involved: customers, suppliers, employees, sellers (for buildup), the State and the banks. Let’s see the difference between value creation and value capture for some of each stakeholder.
The customers
If you increase the price of your solution while leaving the quality unchanged, does it mean that you create value? No, what you are doing is capturing value from your customers.
Same thing if you decrease volume (the so-called “shrinkflation”) or quality (low-cost outsourcing) while keeping the price constant.
Value creation for your customers, for example, is when you deliver a new product, or enter a new geographical market, or you widen the gap in customer value/price.
The suppliers
If you put pressure on unit price and payment terms without any compensation, it means that you are capturing value to your suppliers.
Value creation is when it is not a zero-sum game between you and your suppliers. Reverse factoring, for example, is an excellent win-win situation.
The employees
If you fire 10% of the workforce and the remaining has to take the burden without a process reorganization, you are basically capturing value from your employees.
The same thing if you underpay them or if you expand the working hours/productivity pressure without any compensation.
You create value when you reorganize the process, you automatize with digital tools all the “low value” tasks and so your employees can focus on what is critical for the business
The sellers
If in a buildup you buy at 5x EBITDA and you resell at your platform multiple of 10x, while you made no synergies, then you are not creating value. You are just capturing value from the seller.
On the other hand, if you did a remarkable post-merger integration that resulted in a lot of realized synergies, well, in that case you actually did create value.
The State and the banks
If you did a complex offshore holding structure to lower your effective tax rate, what you actually did was capturing value from the State.
If, for example, during 10 years, you had bank debt at 7x EBITDA for 3% interest rate, then it means that you captured value to the bank since the rate is not representative of the credit risk anymore.
Synergy in M&A is a beneficial result of the deal that both the seller and buyer anticipate. Synergy in M&A means that the value of a newly created combined entity is greater than the value of two separate companies.
There are three main types of synergies in M&A: revenue synergy, cost synergy, and financial synergy. This article focuses on cost synergy.
Continue reading to learn more about cost synergies definition and examples, the main types of cost synergy, how to calculate cost synergies, and the main pitfalls to watch out for in the process of achieving cost synergy.
What are cost synergies?
Cost synergies are the savings in operating costs of a combined company after two companies merge. Such cost savings happen due to increased efficiencies that allow cutting costs in certain areas of business operations.
Thus, cost synergies occur when a combined merged firm can gain greater cost reductions than two companies would gain individually.
Cost synergies examples
Below are the 2 main real-world examples of cost synergies in deal-making:
- Exxon and Mobil (1998)
The $75 billion merger of Exxon and Mobil allowed two separate companies to become the largest oil company in the world. By this deal, Exxon and Mobil united their manufacturing processes and sold many redundant refineries and 2,400 service stations. Additionally, 16,000 employees were laid off. This, in turn, allowed a newly formed company to achieve a $5-billion synergy.
- Nine Entertainment and Fairfax (2018)
The $4 billion merger of Nine Entertainment and Fairfax aimed to create the largest media company in Australia. By this deal, Nine Entertainment and Fairfax united their operations which allowed them to reduce headcount: reportedly, about 144 roles were made redundant which affected 92 people. Additionally, they reached a cost reduction in technology, media sales, and products. As a result, the merged firm achieved a cost synergy of about $65 million.
Note: To discover more real-life examples of different types of M&A deals (both successful and not) and learn from their experience, explore our blog. For instance, you can find the conglomerate merger example in our dedicated article.
Types of cost synergies in M&A
Types of cost synergies largely depend on the forms the cost synergy can take in mergers and acquisitions.
Below is the list of cost synergy types that come from different sources:
- Patents and licensing. In case the acquiring firm was paying the target company for access to its patents, a merger reduces such a need, and thus, helps to reduce overall costs and unlock potential savings.
- Shared information technology. After the completion of all M&A process steps and a merger of two companies, the combined entity gets access to each company’s proprietary information. This helps to increase operational efficiency and improve products without paying extra.
- Supply chain efficiency. If any of the merged companies have better supply chain relationships, the other company can take advantage of it by the merger. As a result, the combined entity might have a streamlined supply chain, which allows for cost savings. This is especially applicable to companies that produce complementary products, such as electronics and accessories, for example.
- Reduced headcount and salary optimization. As a result of a merger of two companies, a combined entity can’t have two CEOs, two Marketing Directors, two CFOs, etc. Thus, a merger of two companies often results in large layoffs of redundant employees. This, in turn, results in large cost savings, since layoffs lead to salary optimization.
- Improved sales and marketing. With a merger, two companies can access better distribution and marketing channels, which enables cost savings in developing and establishing efficient marketing channels by each company individually.
- Shared research and development. A merger of two entities lets either of these companies have access to another’s achievements in the R&D department. This reduces the need for this company to spend on R&D operations on its own and, as a result, brings an opportunity to develop great products and services and save costs.
- Reduced rent. When two companies operate separately, they might have a lot of buildings or equipment to rent. When those companies merge, the need to rent certain buildings or equipment might disappear, which opens room for great cost savings.
How does cost synergy work?
M&A cost synergies occur when two businesses can improve and streamline processes by combining their operations and thus, save costs. This generally works through:
- Eliminating redundancies
When two companies merge, their departments, positions, and equipment might duplicate and become redundant. As a result, the combined company abandons all the redundancies, which creates room for cost savings.
- Economies of scale
When one company merges with another, it creates opportunities for a new company to improve production and overall efficiency. As a result, it helps a combined company to scale faster and easier.
- Staff optimization
A merger of two companies entails the optimization of working capital since there’s no need to have two similar positions or departments. Thus, it creates a cost synergy that allows to cut costs on salaries by massive lay-offs.
- Technology integration
A merger allows two separate companies to migrate into a single IT platform, which can significantly cut costs on licensing. Explore how a technical due diligence checklist can assist you in the process of tech review and integration in our dedicated article.
How to measure the success of cost synergy?
This is what to pay attention to when evaluating whether expected synergies were achieved:
- Cost savings vs. projections
Compare the projected cost savings made during the merger with the actual savings achieved. This involves analyzing expenses, including operational costs, reduced overheads, and eliminated redundancies.
- Financial performance
Check the financial statements and performance metrics of the combined company after the merger. Pay attention to such metrics as profit margins, return on investment (ROI), and earnings before interest, taxes, depreciation, and amortization (EBITDA).
- Operational efficiency
Assess whether the integration processes resulted in streamlined and improved operations. For this, evaluate productivity metrics and improvement timelines.
- Customer and employee satisfaction
Check whether the business integration process has impacted the customer base and whether the employees stay satisfied, productive, and motivated. A successful merger should ideally enhance customer experiences and maintain or improve employee satisfaction.
- Management and stakeholder perception
Pay attention to the way company leaders and stakeholders perceive the results of the merger. The positive perception might indicate the successful integration and synergy, or at least speak about its future potential.
Challenges and pitfalls in achieving cost synergies
While capturing cost synergies, companies combined can experience various pitfalls that might impact the expected results. To achieve the cost synergy you planned for, watch out for the following:
- Synergy overestimation
This is the most common mistake when assessing the potential cost synergies that lead to unrealistic expectations. Ensure you take all the aspects into account when projecting cost synergies’ potential on the deal structuring stage.
- Culture clashes
The merger of two companies is also a merger of two cultures. Often, companies experience difficulties with combining two different cultures into one, like it was with AOL and Time Warner. Such an oversight can significantly impact the post-integration process and the synergy’s success in general. Read more about the post-merger integration checklist in our dedicated article.
- Integration challenges
Combining different systems and processes from the merging entities can be challenging. Aligning operations smoothly requires meticulous planning and execution to avoid disruptions and inefficiencies.
- Regulatory hurdles
Mergers often face scrutiny from regulatory bodies. If the integration plan encounters regulatory obstacles, it can delay the expected average cost synergies in mergers.
- Hidden costs
Often, estimated integration costs turn out to be much higher in reality, which, in turn, significantly impacts the expected cost synergy. Additionally, there can be unforeseen extra cost drivers such as legal fees and costs for retraining employees or updating technologies, which can impact expected synergies.
- Management and stakeholder communication
The quality of communication between merging companies’ leaders and stakeholders is vital for achieving cost synergies. If it’s impossible to establish effective collaboration between the sell- and buy-side, it can result in failed synergy or at least significantly impact its success.
Final words
If the combined value of a newly formed entity is greater than the value of two separate companies before a merger, synergy is created. There are cost synergies, revenue synergies, and financial synergies.
Cost saving synergies are attributed to situations when a combined company can cut costs and thus, generate large cost savings. Among the sources that cost synergies come from are reduced headcount, shared information technology, supply chain efficiencies, shared research and development, reduced rent, and improved sales and marketing.
In 2022, the digital capital raising market showed remarkable growth, reaching $65 billion. By the end of 2023, it’s forecasted to reach $66.26 billion. However, the traditional market still dominated, accounting for almost 90% of the total capital raised in 2022, reaching a staggering $541.8 billion. Still, by the end of 2023, the traditional capital raising market is expected to decrease to $498.9 billion.
However, the landscape is evolving, influenced by trends like technology and biotech shifts, digital platforms, and changing investor preferences. With potential challenges on the horizon, such as the Silicon Valley Bank collapse and a projected drop in capital availability, it’s crucial to approach the process of raising capital with careful preparation.
This guide serves as a roadmap for entrepreneurs, startups, small businesses, and established companies alike, shedding light on the importance of raising capital for fostering growth and driving innovation.
What does it mean to raise capital?
Capital raising refers to the process by which a company secures funds from external sources to finance its operations, innovation, or expansion initiatives.
Capital raising strategy is critical for both startups and established businesses looking to scale their operations.
Here are the six key advantages of raising capital for business:
- Business expansion opportunities. Raising capital provides the financial means to expand operations, enter new markets, and access previously untapped customer segments.
- Innovation and research. It enables businesses to invest in research and development, driving innovation and the creation of new projects, products, and services.
- Talent acquisition. With increased resources, companies attract and retain top-tier talent, fostering a skilled workforce that contributes to business growth.
- Competitive advantage. Adequate capital allows businesses to stay competitive by upgrading infrastructure, technology, and operational efficiency.
- Risk management. Capital serves as a cushion during economic downturns or unexpected challenges, helping businesses maintain stability.
- Strategic acquisitions. Raised capital funds acquisitions of complementary companies, technologies, or assets, accelerating growth and market presence.
Methods of capital raising
There are three main methods of raising capital.
1. Equity financing
Equity capital raising refers to the process of acquiring funds by selling ownership shares to external investors. This method of financing allows the company to raise funds without incurring debt and provides private equity investors with an ownership stake in the company, potentially granting them a share of profits and influence in certain matters, such as voting on company decisions.
Examples of equity raising include:
- Venture capital
Venture capitalists provide capital to startups and early-stage companies with high growth potential. In return, venture capital firms often acquire a portion of the company and may offer expertise and mentorship.
- Angel investors
These are individuals who invest their personal funds in startups. They may also offer mentorship and industry connections in addition to their financial support.
- Equity crowdfunding
This involves a large number of people collectively investing in a startup or an early-stage company through crowdfunding platforms like Kickstarter, AngelList, or IndieGoGo, allowing smaller investors to participate and potentially gain equity ownership.
- Seed funding
This is the initial capital raise that supports the development of a business concept, which often comes from angel investors, friends, or family.
- Initial public offering
In an initial public offering (IPO), a private business becomes a public company by issuing shares to the general public on the stock market. This provides access to a large investor pool and can raise substantial capital.
- Institutional investors
These include mutual funds, pension funds, hedge funds, banks, and insurance companies. They invest large sums of money, favoring established businesses for a greater assurance of return.
For those interested in how to start a hedge fund, you can find a dedicated article in our Insights section that provides valuable guidance.
2. Debt financing
Debt raising is when a company raises funds by borrowing money that needs to be repaid over time with an interest rate. Here are its main types:
- Bank loans
Businesses borrow from banks or financial institutions, agreeing to repay the principal amount with interest over a set period. Loan terms and interest rates vary based on the company’s creditworthiness and the lender’s terms.
- Corporate bonds
Companies issue bonds to investors, promising to pay interest and return the principal upon maturity. Bonds provide investors with a fixed income stream and allow businesses to tap into debt markets.
- Merchant cash advance
Merchant cash advance (MCA) provides businesses with immediate funds. Repayment involves deducting a fixed percentage from daily sales, along with a fee, until the advance is fully paid. This quick-access financing option suits businesses with steady sales.
3. Hybrid financing
Hybrid financing refers to a financial approach that combines elements of both equity and debt financing. Potential sources of hybrid financing include:
- Preferred shares
They offer advantages over common shares, such as dividends and liquidation priority. Some preferred shares are convertible to common shares under specific conditions, allowing investors to benefit from potential growth while enjoying fixed-income payments.
- Convertible debt
Companies often use a convertible debt raise, which starts as a loan but can be converted into equity shares. This financing option typically suits companies with a low credit rating but high growth potential.
How to select the best method of raising capital for a business
There are several critical factors to consider when selecting the best method of raising funds. Here’s a 3-step guide.
1. Assess your business needs and goals
Start by evaluating the business’s current financial needs and identifying why the company requires capital. Is it to fund product development, facilitate corporate growth, expand operations, or address cash flow issues? Clearly define the business goals and determine how much money is needed to achieve them.
2. Analyze the pros and cons of different methods
Consider the advantages and disadvantages of each method in relation to the business’s needs, goals, and risk tolerance. For example:
- Equity financing can bring experienced investors and strategic partners but may lead to loss of control
- Debt financing provides immediate capital without diluting ownership but requires repayment
- Hybrid financing offers flexibility in balancing potential returns and security but introduces complexity and risk of eventual equity dilution.
3. Tailor the method to the industry and growth stage
The best method of raising finance varies depending on the industry and business growth stage. For example, tech startups might opt for venture capital, while mature companies might prefer traditional bank loans. Consider what’s common and successful within the industry.
Capital raising process in 11 steps
Here’s a general overview of the capital raise process:
- Assess how much capital is required and for what purpose. This involves creating a detailed budget and financial plan to understand the funding requirements.
- Identify the most suitable method of raising investor capital for the business.
- Prepare a business plan and pitch. This should outline the company’s goals, financial projections, analysis of market conditions, and the potential return on investment for funders.
- Consider legal and regulatory compliance. For example, if going public through an IPO, the company must comply with securities laws and regulations, such as The U.S. Securities and Exchange Commission (SEC) or the Sarbanes–Oxley Act of 2002 (SOX).
- Seek out potential investors or lenders who align with the business’s goals and values. This may involve networking, attending investor conferences, or engaging with venture capitalists or banks.
- Facilitate the due diligence process by preparing all necessary documents in advance. Consider using a virtual data room as a secure tool for sharing confidential information.
- Negotiate terms and agreements once investors or lenders are interested. Negotiations include discussing the valuation of the company, interest rates, equity stakes, and other terms and conditions.
- Secure the necessary funds and sign legal contracts. Equity financing may involve issuing shares, while debt financing involves disbursing loans or bonds.
- Utilize the raised capital for its intended purpose: operational expenses, expansion, research and development, or other specific projects. Otherwise, you might simply fail to reach the set objectives.
- Manage the funds post-raising, fulfill any repayment obligations for debt financing, and work toward achieving the goals outlined in the business plan.
- Regularly provide updates to investors and lenders on the company’s financial performance and progress toward set milestones in an agreed way, if that was required by investors and lenders.
Challenges and solutions in raising business capital
To ensure successful capital raising, entrepreneurs need to be ready to address various challenges.
Challenge 1: Investor alignment
- Risk
Finding investors whose goals, values, and expectations align with the business’s mission and growth capital plans.
- Solution
Thoroughly research potential investors, communicate the business plan clearly, and seek investors who understand and share the same long-term objectives.
Challenge 2: Valuation
- Risk
Overvaluing or undervaluing the business deters potential investors or leads to unfavorable equity raise terms.
- Solution
Conduct thorough market research and financial analysis to determine a realistic valuation. Seek professional advice or use valuation methods like discounted cash flows or comparable transactions.
Challenge 3: Dilution of ownership
- Risk
Equity financing leads to loss of control and ownership as more investors come on board.
- Solution
Negotiate favorable terms, consider hybrid financing or convertible securities to delay dilution, and retain a sufficient equity stake to maintain decision-making authority.
Challenge 4: Investor due diligence
- Risk
Investors must perform due diligence to assess the business’s financial health, management team, and growth potential, which is time-consuming.
- Solution
Prepare comprehensive documentation, including financial statements (the balance sheet, income statement, and cash flow statement), business plans, and legal agreements. Streamline the process by addressing potential concerns proactively.
Capital raising for technological innovation
To foster innovation, tech companies often turn to innovation funding as a means to fuel their growth and stay competitive. Let’s explore some critical aspects of capital raising for technological innovation, with a focus on the considerations that tech companies must keep in mind:
- Intellectual property protection
Tech companies often rely on proprietary technologies and intellectual property (IP) assets. Before seeking innovation funding, it’s crucial to have a strong IP strategy to safeguard innovations and make them more attractive to investors.
- Scalability
Tech innovations must have the potential for scalability. Investors are drawn to growing ideas, so demonstrating a clear path to scale your products or services is essential.
- Team expertise
The team behind a tech company is often a critical factor for investors. Highlighting the expertise and experience of the team members instills confidence in potential investors.
- Regulatory compliance
Tech innovations are subject to various regulations and compliance requirements, especially in fields like fintech, healthcare, and biotechnology. Understanding and addressing these regulations is crucial in attracting investment bankers.
Looking to prepare for an investment banking interview? Explore our article on investment banking interview questions for valuable insights and tips.
Role of innovation in attracting investment
Innovation and capital raising are closely connected in the tech industry. Here’s why:
- Competitive edge
Innovative tech solutions give companies a competitive edge as investors seek opportunities that stand out in crowded markets.
- Market potential
Innovation opens up new markets or expands existing ones. Investors are more inclined to support companies that have the potential to access untapped markets.
- Long-term viability
Innovative tech solutions are future-proof. Investors are more likely to commit capital to companies that demonstrate long-term viability by addressing evolving market needs.
- Return on investment
Tech innovations have the potential for high return on investment (ROI), making them attractive to investors seeking substantial returns.
Key takeaways
- Capital raising is the process of securing external funds to finance a company’s operations, innovation, or expansion efforts in the form of either debt or equity.
- The key reasons why companies raise capital include business expansion opportunities, innovation and research, talent acquisition, competitive advantage, risk management, and strategic acquisitions.
- The three main methods of raising money are equity financing, debt financing, and hybrid financing, each with its own advantages and considerations.
- The process of raising capital involves assessing capital needs, identifying suitable methods, preparing a business plan, considering legal compliance, seeking investors, facilitating due diligence, negotiating terms, securing funds, and managing post-funding.
- Challenges in raising capital include investor alignment, valuation, dilution of ownership, and investor due diligence, each requiring careful consideration and proactive solutions.